Description
The 4530 series RF Peak Power Meter can make Peak, CW Power and RF Voltage measurements at high speed from 10 kHz to 40 GHz.
Quick Features
- Frequency: Peak Power 50 MHz – 40 GHz / CW Power 10 kHz – 40 GHz
- Dynamic Range: Peak Power >60 dB / CW Power 90 dB
- Effective Sampling Rates up to 50 MSamples/sec
- Synchronous/Asynchronous Triggering
- Dual-channel statistical measurements (CDF/PDF)
- Modulation bandwidth to 20 MHz
- GPIB – SCPI / RS232 commands
- LabVIEW drivers available
Boonton’s 4530 Series RF power meters combine the accuracy of a laboratory-grade instrument with the speed required for production test. They employ proprietary measurement techniques that accurately measure digitally-modulated signals. Whether you’re measuring CW power or the peak power of w-cdma or hdtv signals, Boonton’s single-channel Model 4531 and dualchannel Model 4532 are the logical choice for high-volume production test.
More Than Power Alone
The 4530 is more than a simple RF power meter. It measures CW power, peak power, voltage, and performs statistical power analysis (cdf and pdf) as well. The 4530 is compatible with a wide variety of Boonton RF power and voltage sensors, from coaxial dual-diode types, to thermal sensors, for measurements up to 40 GHz. Sensor set-up is easy and accurate too, since calibration and set-up data are automatically downloaded from the sensor, as soon as it’s plugged in. The 4530 provides seamless CW power measurement over its broad dynamic range—without the interruptions and nonlinearities caused by range changes required by lesser power meters. Our thermal and peak-power sensors never need range switching, and even our CW diode sensors—with 90 dB dynamic range—use only two widely overlapping ranges.
Future Perfect
The 4530 measures the precise peak and average power of today’s complex digitally-modulated carriers. Modulation bandwidths up to 20 MHz are within the range of the 4530, which makes it a good choice for measuring cdma, w-cdma, cdma2000, tdma, gsm, gsm-edge, gprs, ofdm, hdtv, and umts. The 4530 displays periodic and pulse waveforms in graphical format, and a host of automatic measurements characterize the time and power profiles of the pulse. Powerful triggering, effective sampling rates up to 50 MSamples/sec. and programmable cursors give you instantaneous power measurements at precise time delays from the pulse edge. With an internal or external trigger you can perform time-gated or power-gated peak and average power measurements as well. Triggering can be synchronous or asynchronous. Display can be adjusted to pre-trigger or posttrigger to view any portion of the waveform. For cdma or other spread-spectrum signals, the 4530’s statistical analysis mode allows full profiling of power probability at all signal levels. The 4530 makes even these complex measurements fast, thanks to sustained acquisition rates above 1 MSample/ sec. and smooth, range-free operation that allows a representative population to be acquired and analyzed rapidly.
Relief For Amplifier Designers
The random and infrequent nature of power peaks makes them almost impossible to detect and measure with conventional power meters. That means you’ll never know how an amplifier will perform in the field when driven into compression by these fleeting peaks–until it’s too late. The 4530 gives you this critical information by analyzing the probability-of-occurrence near the point of absolute peak power, then detecting and analyzing the data with the high accuracy required to realistically evaluate an amplifier’s performance. And with its wide video bandwidth, the 4530 detects even narrow peaks. The 4530’s dual-processor architecture enables comprehensive measurements with high speed and performance. It eliminates the speed tradeoffs between data acquisition and output via GPIB that are a fact of life with other power meters. A highspeed, floating-point digital signal processor (DSP) performs the measurements, gathers and processes the power samples from the sensors, timestamps the measurements, and provides linearity correction, gain adjustment and filtering—all in less than a microsecond.
The processed measurements are then passed to a dedicated, 32-bit I/O processor that sends them to the LCD display and over RS-232 or GPIB interfaces when formatted measurements are required. Programming is easier as well, thanks to comprehensive use of the industry standard SCPI command syntax.
Modulated Average Power, Peak Power and More
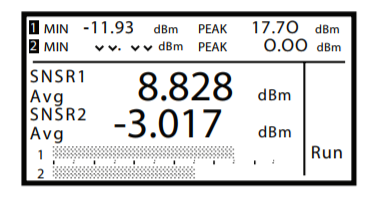
Using Boonton Peak Power sensors, the 4530 Series can measure the true average power of modulated waveforms, while providing important information about the instantaneous peak power missing in other power meters using “universal” power sensors. The absolute peak power and crest factor are available, plus the held minimum and maximum average powers for viewing longterm trends and Boonton’s exclusive peak tracking mode allows short term crest factor measurements to be made on real signals without the need to manually reset the held peak every time the signal level changes. A flexible text display shows the measurements for one or both channels, and a “chart recorder” display of average power may be displayed graphically.
Continuous or Pulse Measurements
In many of today’s digital modulation formats, the data is transmitted in short bursts, and the RF carrier is then switched off to allow other users to occupy the same channel (often known as time division multiple access, or tdma). In these signals, there are important restrictions not only on the power of the burst, but also on the edge positions within a data frame and the slopes of those transitions.
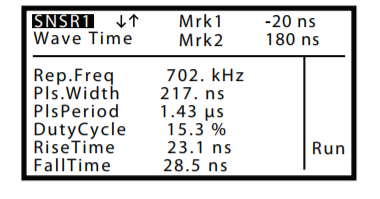
Pulse Mode is designed to feel familiar to most engineers and technicians — the instrument can be operated in much the same way as a digital oscilloscope. Flexible timebase and triggering capabilities allow you to quickly view and measure pulse or burst waveforms. Common pulse power and timing measurements can be set up and performed automatically by the instrument, or can be defined manually for optimum flexibility.
Two programmable cursors can be used to measure instantaneous power at two time offsets relative to the trigger, or to define a time interval, also known as a “time gate” over which average and peak power measurements may be made.
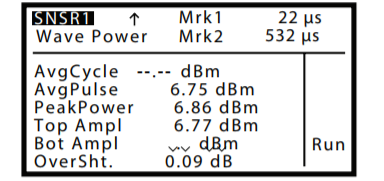
The pulse average and peak power, width, frequency, and edge transition times are just a few of the many automatic measurements performed.
High-Speed Statistical Measurements
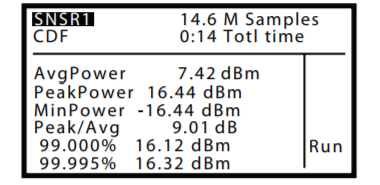
In addition to its industry-leading performance with pulse and burst modulated signals, the 4530 Series offers the only true solution for characterizing non-periodic signals such as CDMA and HDTV. These wideband signals are often noise-like, with many brief peaks that vary in magnitude and frequency of occurrence. Measuring the average power of a spread spectrum signal does little to indicate how well an amplifier is coping with these peaks. Even adding a crest factor display only gives information about the highest peak (which by definition, only occurs once, and is of little value in predicting error rate). The only way to accurately characterize these signals is to build a very large population of power samples in a short time, and analyze the statistical probability of occurrence of each power level.
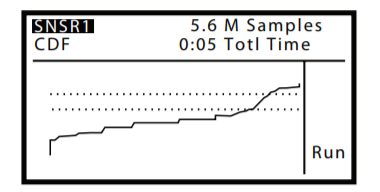
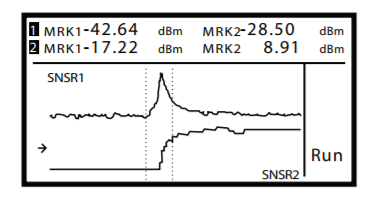
The Cumulative Distribution Function, or CDF, displayed by the 4530 plots the probability that the power will be at or below a specified level. By examining the areas close to 100% probability, it is possible to see how often the highest peaks occur. It is easy to see amplifier compression under actual operating conditions, and to predict the effect on error rate that this may have.
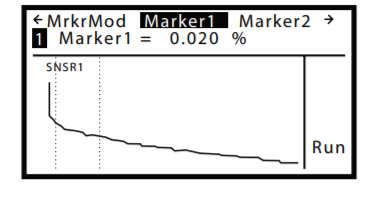
The 4530’s Statistical Mode allows you to place one or two vertical or horizontal cursors on the plot, and read the percent probability for a particular power level, or the power at a probability. And of course the accumulated average, peak and minimum powers for the entire population may be displayed. As with all measurement modes, the graph display includes complete pan and zoom ability, and can present the data in CDF, CCDF or distribution (histogram bar) formats.
Wideband CDMA Power
The 4530’s wide bandwidth, high speed sampling and digital signal processing speed allows fast and accurate characterization of current and future CDMA2000 and W-CDMA formats.
Boonton’s sensor architecture allows measurement of the entire dynamic range of a signal without range switching and its associated bandwidth limiting as the signal level changes. This allows modulated and peak measurements of wide dynamic range signals, but is doubly important for statistical measurements, since changing the range and bandwidth for a portion of samples would invalidate the statistical properties of the entire sample population, and render the measurements meaningless. In addition to bandwidth, the 4530’s high sustained sampling and processing speed ensures that few of the narrow peaks of wideband signals will fall between samples, and a representative population can be acquired in seconds.
GSM and Beyond
The standard gsm signal uses a digitally modulated burst to transmit data. Each user is allocated one of eight timeslots and must only transmit within its assigned timeslot. In addition to controlling power when on, an on/off ramp profile must be carefully followed to avoid interference with other users.
The 4530’s pulse mode is ideal for measuring all power and timing parameters of current and future gsm formats. With trigger delay and holdoff, it is possible to synchronize on difficult bursts, and measure power at any instant or over any interval, whether pre- or post-trigger.
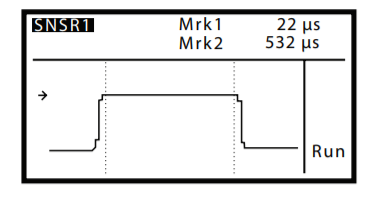
Two programmable cursors allow power measurements on the active portions of each timeslot, while excluding the transition intervals between, or can be used to examine the ramp profile during timeslot transition intervals. Interval (or time gatedî) measurements include average as well as peak and minimum power.
Automatic Time Gating
For measurement of single bursts such as the GSM reverse link, the 4530’s automatic time gated pulse measurements can be used to quickly measure the “on” power during the active portion of the burst while excluding the edge transitions. For example, the time gating may be set to measure the burst between the 3% and 97% time points. For a GSM burst (on time about 564 μS) this means that the leading and trailing 17 μS will be excluded, and the reading will be the average power of the burst during the middle 530 μS.
Specifications