Description
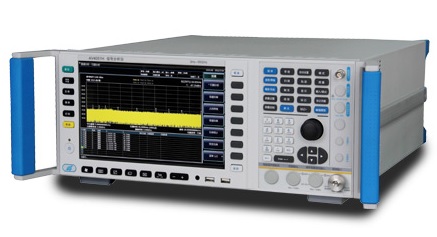
4500B RF Peak Power Analyzer
The Boonton Model 4500B is the instrument of choice for capturing, displaying, analyzing and characterizing RF power in both the time and statistical domains. Applications include pulsed RF such as RADAR, TDMA and GSM, pseudorandom or noise-like signals such as CDMA and WLAN and modulated time slotted signals such as GSM-EDGE and TD-SCDMA.
The 4500B features 100 psec timebase resolution, video bandwidth up to 65 MHz (sensor dependent), flexible triggering and greater than 70 dB dynamic range (sensor dependent) without any range switching to cover the most demanding peak power measurement applications. The 4500B also features continuous statistical analysis of power (optional) at acquisition rates up to 25 MSa/s, a text display of up to 15 automatic measurements per channel as well as envelope and persistence views to provide fast in-depth signal analysis. Convenient I/O including USB ports for storing data such as instrument setups, trace waveforms and bitmap image files.
Features
- 8.4″ TFT color LCD display
- Displays up to 4 measurement channels, 2 memory channels and 1 math channel simultaneously
- Automatic peak-to-peak, delay-by-time and delay-by-events triggering
- Statistical analysis including gated CCDF and PDF with linear or log presentation (optional)
- Text view of up to 15 time and power measurements per channel
- Envelope, persistence and roll mode displays GPIB, USB and LAN
- Peak Power Sensors available with high video bandwidth, fast risetime, and wide dynamic range
- Video bandwidth up to 65 MHz
Superior Time Capture
The Boonton 4500B features a large 8.4″ diagonal TFT color LCD, 640 x 480 pixels, with CCFL backlight for a clear view of up to two live RF channels, two live trigger channels, two stored memory channels and one live math channel simultaneously.
The need to clearly view multiple channels can be invaluable in many applications. The large color display in the 4500B is especially well suited for multiple channel applications. User selectable colors are used to distinguish overlapping traces and to color correlate graphical channel data with its measurements. For example, if the color of the channel 1 is yellow, then the measurements calculated on channel 1 are also yellow. The traces and measurements are clearly marked and color correlated.
The 4500B gives the user the flexibility to customize the display by allowing them to select the measurements or specific parametric settings and measurement indicators they wish to display. These measurements can be grouped to avoid clutter.
Figure 1: Analysis of CDMA Pulse Train with RF and Trigger Channels
Updating Simultaneously
Unique Trigger System
The 4500B features a unique trigger qualifier that allows a user to qualify the trigger on a specific event or a specific delay time allowing a user-selected pulse to be captured, even when its timing is variable. Modern communications signals typically have long frames of data and it is often important to lock a peak power acquisition to a specific time slot or to a specific event within a group. The B trigger qualifier eliminates problematic synchronization issues associated with time jitter within pulse bursts that are often found in UWB and RADAR applications. This qualifier may be set up to 999,999 events or up to 1 second.
Figure 2: Qualify the Trigger on a Specific Event in CDMA pulse train
Automatic Analysis
The 4500B provides power-versus-time waveform analysis of repetitive RF signals. Applications include TDMA and GSM, as well as RF amplifier linearity testing, RADAR, satcom, and avionics. The timebase extends to 5 nsec/div and the logarithmic power display will show more than 70 dB dynamic ranges at the same time.
Peak power sensors are available that feature <7 nsec risetime (video bandwidth up to 65 MHz) and dynamic range of 70 dB (pulse mode) or 80 dB (modulated mode). These sensors have been optimized for use with the 4500B and are ideal for measuring RADAR or signals in 3G and future 4G wireless systems that use complex modulation such as OFDM.
Two adjustable markers can read the power at any point across the waveform. In addition, the markers can be used to define the portion of the waveform in which the maximum power, minimum power, long term average power and peak to average ratios are measured. This is especially useful for characterizing the power level over a portion of the top of a pulse. An auto measure function measures and calculates 15 common power and timing parameters. All parameters for up to four active channels are summarized in a Text display and are also available as user defined display parameters above the Graph display.
Figure 3: Pulsed RF including width, rise time & fall time measurements
Powerful Statistical Analysis
The 4500B features optional probability density functions (PDF) and cumulative distribution functions (CDF, CCDF) to accurately characterize noise-like RF such as CDMA, HDTV and WLAN. These statistical functions build and analyze a very large population of power samples continuously at a rate of up to 25 MHz or triggered up to 50 MHz on two channels simultaneously. These functions are fast, accurate and allow the measurement of very infrequent power peaks for a user-defined population size or acquisition interval. Although the programmable acquisition time can be very long or continuous, even short runs can resolve very low probabilities, due to the extremely high sample throughput.
Figure 4: Analyze CDMA timeslots with time gated probability density function (PDF)
Specifications


